
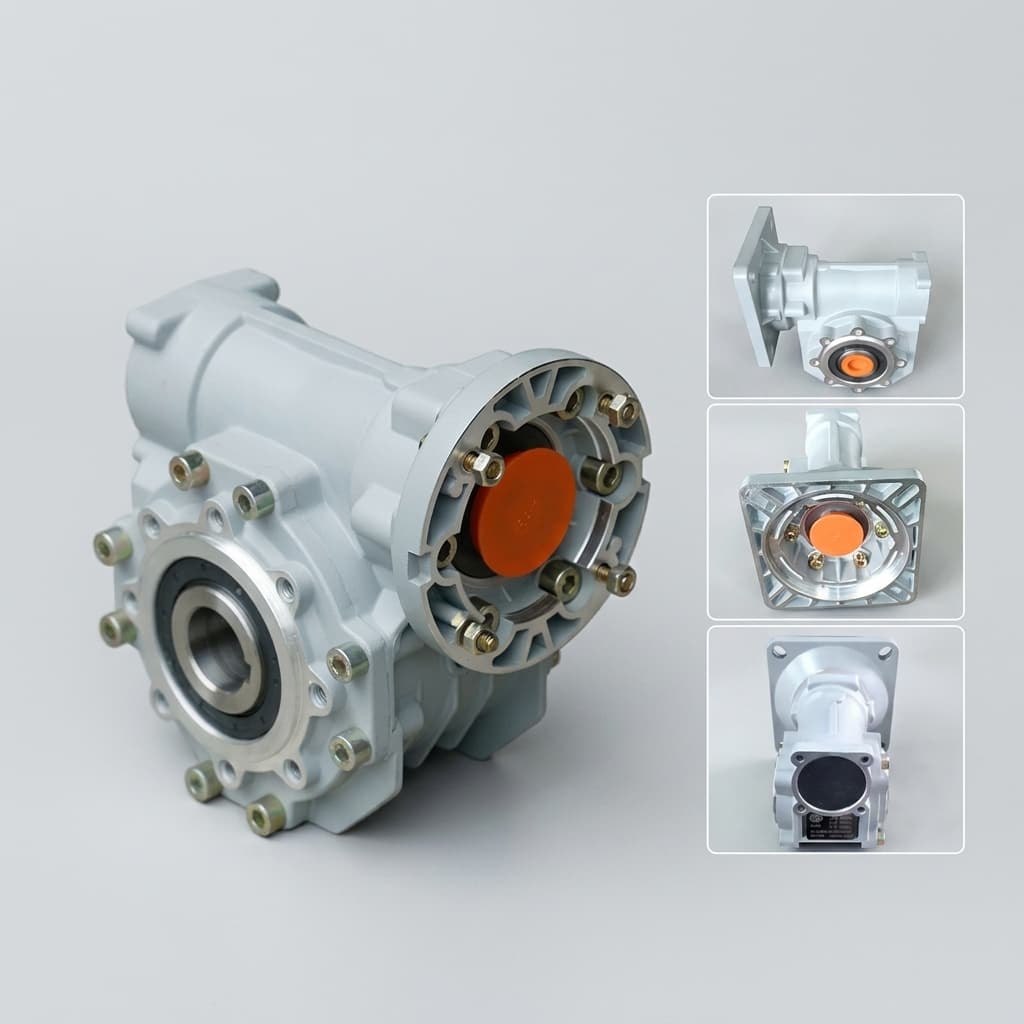
RV Reducer Lost Motion, Hysteresis, and Backlash: Engineering Sizing for Torsional Rigidity, Standards Compliance, and Factory Quality Audits
Understand RV reducer lost motion, backlash and hysteresis. Estimate TCP deflection, compare test methods, and prepare an engineering RFQ with a FAT checklist.
RV reducer lost motion, backlash and hysteresis describe different parts of joint behavior. A small catalog backlash number does not establish loaded tool center point (TCP) accuracy. Engineers need the torque-angle curve, operating load and effective lever arm; buyers need a test method and acceptance limits that can be compared across suppliers.
This guide provides a reproducible sizing example and a factory acceptance testing (FAT) checklist. It separates reducer measurements from robot-level standards compliance and identifies the evidence to request before approving a purchase.
For baseline specifications, review our backlash and torsional rigidity reference, lifetime testing and inspection protocols, and heavy payload robot reducer selection guide.
To compare supplier curves against your error budget, send the axis duty cycle and required TCP tolerance to our engineering team.
Engineering and sourcing takeaways
- Define the metric: Backlash concerns zero-torque hysteresis width; lost motion characterizes a low-torque region. Require the exact measurement convention.
- Use the operating slope: A single catalog stiffness value can conceal different behavior near reversal. Three-zone fits are useful only when their boundaries and slopes are supplied or measured.
- Convert angles into process error: At a 1,450 mm effective lever arm, 1 arcmin corresponds to approximately 0.422 mm. Loaded deflection needs a separate calculation.
- Keep dynamics separate: Stiffness and inertia influence natural frequency; damping, feedback and tuning also affect settling time.
- Buy evidence: Agree serialized records, sampling, uncertainty and acceptance limits before placing the order. A smooth curve alone does not authenticate a certificate.
1. Scope, Operational Boundaries, and Content Date
Published and content reviewed: November 3, 2026. Region: Global; language: English. This guide is for automation engineers, integrators and procurement teams selecting precision cycloidal reducers for robot joints, rotary tables and positioners.
The calculations assume one loaded rotational axis, a rigid link and a perpendicular effective lever arm. The illustrative FAT condition is 20°C ± 2°C; it is a proposed purchase condition, not a universal standard requirement. The model excludes link bending, bearing tilt, mounting compliance, thermal drift and other joints. For a real robot, combine joint errors through the kinematic Jacobian and validate the installed machine.
Evidence boundary: The worked example and SVGs are analytical illustrations, not measured factory results or product guarantees. No specific supplier grade, cleanroom suitability, collaborative robot safety rating or service life is certified here. Obtain model-specific limits and the applicable standard edition and clauses for the purchase contract.
2. Backlash vs. Lost Motion vs. Torsional Stiffness
2.1 Backlash and the Zero-Torque Hysteresis Width
Geometric backlash is free play caused by clearances. In a practical torque-angle test, the angular width of the hysteresis loop at zero torque also reflects the preceding loading history and internal friction. It should not automatically be equated with an isolated tooth clearance.
Cycloidal load sharing and preload can reduce free play, but do not prove zero backlash or a universal 0.05 arcmin limit. Compare the named model's declared metric, test mounting and measured curve. The Nabtesco FAQ distinguishes torsional rigidity, hysteresis loss and lost motion as separate characteristics.
2.2 Lost Motion: Agree the Low-Torque Test Convention
Nabtesco catalog terminology uses a low-load region of ±3% of rated output torque, with the input fixed, to characterize lost motion. This is a manufacturer measurement convention; confirm whether another supplier uses the same torque range, loading sequence and angular extraction method. The selected branch or centerline matters when reading a hysteresis loop.
For an agreed protocol that reports the span between specified positive and negative low-torque reference angles:
T_0 = 0.03 × T_N
Δθ_LM = |θ_ref(+T_0) - θ_ref(-T_0)|    [arcmin]
Do not compare a one-sided angle with a full reversal span. A 0.5 or 1.0 arcmin requirement is an RFQ acceptance target only when the selected model, conditions and uncertainty support it.
Standards boundary: ISO 9283:1998 concerns performance testing of industrial robots. It does not establish this component's ±3% torque convention or certify a reducer from its hysteresis plot. For any claimed national-standard compliance, require the correct designation, edition, applicable clauses and actual test report; this guide does not assert clause-level compliance.
2.3 A Supplier-Specific Three-Zone Stiffness Fit
Torsional rigidity is the slope of torque versus angle over a stated interval, usually in N·m/arcmin. Contact deformation, load sharing and friction can make the curve nonlinear. Some suppliers use one fitted slope; others provide several. K1, K2 and K3 are labels for a fit, not universal RV precision grades.
The 2021 study of harmonic-drive lost-motion sensitivity examines a different reducer architecture. It is useful context for parameter sensitivity, not evidence for specific RV stiffness ratios.
In the illustrative model below, T0 is the low-torque reference, T1 and T2 are fitted boundaries, and TN is rated torque:
Low-torque region:   0 ≤ |T| ≤ T0     Use the measured low-torque curve
Zone 1:             T0 < |T| ≤ T1    Fitted slope K1
Zone 2:             T1 < |T| ≤ T2    Fitted slope K2
Zone 3:             T2 < |T| ≤ TN    Fitted slope K3
The example uses T1 = 15% TN and T2 = 50% TN. These are declared assumptions, not typical thresholds or guaranteed pin engagement fractions. Use the slope at the actual operating torque for small-signal dynamic analysis, and do not extrapolate beyond the measured range.
Figure 1. Schematic torque-angle loop and slope regions, not to scale or fitted to a product. Follow the supplier's branch selection and extraction method when measuring lost motion.
3. TCP Deflection and Dynamic Resonance Modeling
3.1 Avoid Double-Counting the Low-Torque Deflection
Lost motion already includes low-torque deformation. Adding half the lost-motion span to an elastic integral starting at zero can count that region twice.
For a symmetric illustrative curve, take the angular reference at positive T0 as half the agreed span. For positive loading beyond T0, integrate only the additional angle above that reference:
θ0 = Δθ_LM / 2                        [arcmin, centered reference assumption]

T0 < T ≤ T1:
  θ(T) = θ0 + (T - T0) / K1
T1 < T ≤ T2:
  θ(T) = θ0 + (T1 - T0) / K1 + (T - T1) / K2
T2 < T ≤ TN:
  θ(T) = θ0 + (T1 - T0) / K1 + (T2 - T1) / K2 + (T - T2) / K3
For this example only, interpolate between zero and θ0 below T0. A real hysteretic joint needs measured loading and unloading branches; do not assume symmetry or use this centered reference as a guaranteed worst-case error bound. Include gravity, acceleration and process torque with their signs when finding the operating point.
3.2 Worked Example: Hypothetical Robot Shoulder Axis
These inputs are assumptions, not measurements of a robot or a purchasable reducer:
| Input | Assumed value | Purpose |
|---|---|---|
| Effective perpendicular TCP lever arm L | 1,450 mm | Converts joint angle into tangential displacement |
| Rated output torque TN | 2,500 N·m | Defines this example's torque scale |
| Total load torque T | 1,800 N·m | Includes the assumed operating load; 72% TN |
| Full low-torque span Δθ_LM | 1.0 arcmin | Defines the centered low-torque reference |
| Low-torque reference T0 | 75 N·m | 3% TN |
| First boundary T1; slope K1 | 375 N·m; 350 N·m/arcmin | Additional angle above T0 |
| Second boundary T2; slope K2 | 1,250 N·m; 580 N·m/arcmin | Intermediate load region |
| Upper-region slope K3 | 750 N·m/arcmin | Used only above T2 |
θ0 = 1.0 / 2                                      = 0.500000 arcmin
Zone 1 increment = (375 - 75) / 350                = 0.857143 arcmin
Zone 2 increment = (1,250 - 375) / 580             = 1.508621 arcmin
Zone 3 increment = (1,800 - 1,250) / 750           = 0.733333 arcmin
θ_total                                           = 3.599097 arcmin

θ_rad = θ_total × π / 10,800
δ_TCP = L × sin(θ_rad) ≈ L × θ_total × 0.000290888
δ_TCP = 1,450 × sin(3.599097 × π / 10,800)          ≈ 1.518 mm
By comparison, 1 arcmin alone corresponds to 0.422 mm at this lever arm. The assumed loaded angle is about 3.60 times that angular value. This comparison demonstrates why the load curve matters; it is not a measured accuracy loss, a general multiplier or a worst-case reversal estimate. Compare the calculated contribution with the allocated joint error budget before accepting the candidate.
3.3 Natural Frequency Is Not a Settling-Time Guarantee
With a fixed drive side and a single load inertia, an initial screening model is:
K_rad = K_local × (10,800 / π)                     [N·m/rad]
f_fixed = (1 / (2π)) × sqrt(K_rad / J_load)        [Hz]
K_local is the incremental stiffness at the operating point and J_load is in kg·m². Multiplying N·m/arcmin by approximately 3,437.75 converts it to N·m/rad. This fixed-side estimate does not represent every resonance and anti-resonance of a two-inertia servo system.
If both inertias can move, an ideal undamped two-inertia model has a relative-mode frequency of sqrt(K_rad × (1/J_drive + 1/J_load)) / (2π), with both inertias referred to the output side. Mounts, links, feedback, damping and filters change the installed response. Neither K3 alone nor an arbitrary 18–20 Hz threshold predicts a universal servo gain or a 40–300 ms settling time. Measure the axis response and tune against the required process tolerance.
Figure 2. Exaggerated joint twist and illustrative response shapes. The curves contain no measured time scale or promised settling performance; settling must be measured against a stated tolerance band.
4. Supplier Comparison: Evidence to Request Before Selecting a Reducer
Compare candidate models under matching load, temperature, lubrication and mounting conditions. The six rows below form a comparison worksheet; they deliberately avoid assigning universal performance numbers to reducer architectures.
| Comparison item | Evidence to request for each candidate | Selection or acceptance decision |
|---|---|---|
| Lost motion | Full span, test torque, branch convention and raw angle data | Compare equivalent metrics with your reversal error allocation |
| Backlash / hysteresis loss | Zero-torque width and loading history | Keep this separate from loaded deflection |
| Torsional stiffness | Curve, fitted intervals, slopes and units | Calculate deflection at the actual operating torque |
| Torque and duty limits | Continuous, acceleration and emergency-stop limits with duration | Check each load case; no universal shock multiplier |
| Bearing and mounting compliance | Moment stiffness, bearing load limits and fixture definition | Add tilt and mounting error to the TCP budget |
| Dynamic and thermal behavior | Axis-level settling criterion, inertia, tuning and hot-state data | Verify the installed process; catalog stiffness cannot guarantee cycle time |
For hollow-shaft, solid-shaft, strain-wave, planetary or direct-drive alternatives, request these same evidence categories where applicable. Direct drive removes gear mesh clearance, but bearings, structure and closed-loop control still have finite stiffness.
If quotations use different definitions, request help aligning the test and RFQ conditions before ranking suppliers by a single arcminute figure.
5. Factory Acceptance Testing and Quality Audit Protocol
The following is a proposed procurement protocol, not a transcription of a standard. Confirm feasibility and acceptance limits with the supplier. Use robot-level performance tests separately when a complete machine must satisfy ISO 9283.
Rigid fixture → Locked input → Reducer → Output torque arm / actuator
                                  │
                                  └→ Calibrated output-angle measurement
Record torque, angle, loading direction, time, temperature and serial number.
5.1 Bench Conditions and Measurement Uncertainty
- Fixture and mounting: Document input clamping, output reference, mounting torque and compliance correction. Clamp slip and fixture twist can widen the apparent loop.
- Calibrated metrology: Select torque and angular accuracy against the acceptance limit. A 24-bit encoder has a theoretical step of approximately 0.077 arcsec per revolution count, but resolution does not establish absolute accuracy or total measurement uncertainty.
- Conditioning and sweep: Agree lubricant, run-in, sweep range, rate, dwell and repeat count. Three conditioning cycles may be a starting proposal; demonstrate repeatability rather than treating that number as a standard mandate.
- Temperature: Agree stabilization and measurement locations. For a hot-running axis, request an additional test at the intended operating state within the manufacturer's limits.
- Acceptance rule: State the full-span limit, stiffness intervals, repeatability requirement and uncertainty decision rule before testing. Choose 100% serialized testing or a documented sampling plan based on process risk and cost.
5.2 Report Red Flags and Follow-Up Actions
- Asymmetric branches: Request repeat runs with alignment and fixture checks. Lubrication, friction, mounting and internal defects can all contribute; the shape alone cannot diagnose a particular machining fault.
- Kinks or plateaus: Inspect raw synchronized samples, filtering, sensor saturation and clamp slip before attributing the feature to loose pins.
- Narrow loops with high running torque: Compare input drag, temperature and lubricant conditions with model-specific limits. Excessive preload is a possible cause, not a proven diagnosis or a basis for predicting hours to failure.
- Identical curves or missing identity: Match serial numbers, calibration records and raw data to the delivered units, and witness a repeat test where necessary. A smooth plot or high encoder bit count is not proof of authenticity.
6. Sourcing and Engineering RFQ Checklist
Use these ten items as a handoff between engineering, procurement and supplier QA:
- Metric and method: State full-span versus one-sided reporting, test torque, input restraint, sweep sequence and applicable standard clauses where verified.
- Acceptance limits: Specify the application's lost-motion and backlash limits; make any 0.5 or 1.0 arcmin target conditional on the offered model and agreed test.
- Stiffness data: Request the torque-angle curve, fitted slopes, boundaries, units and the temperature at which they apply.
- Traceable inspection: Agree serialized records, raw data retention, calibration evidence, sampling and the measurement-uncertainty decision rule.
- Duty and stop cases: Supply gravity, acceleration, process loads, speed, cycle duration and emergency-stop profile; check continuous and peak limits separately.
- Bearing and flange requirements: Specify radial, thrust and moment loads, moment stiffness and drawing-based runout limits.
- Starting and running torque: Agree measurement speed, temperature and lubricant so drag readings can be compared fairly.
- Lubrication: Record the exact manufacturer-approved lubricant, fill quantity, orientation and maintenance interval; do not assume grease equivalence.
- Thermal acceptance: Define the actual ambient and housing temperature envelope and any hot-state accuracy tests within published operating limits.
- Traceability and handover: Request model, ratio, serial and batch identity, agreed material records, installation instructions and warranty test conditions.
7. Frequently Asked Questions
What is the difference between backlash and lost motion in an RV reducer?
Backlash concerns clearance or a zero-torque hysteresis width, depending on the stated definition. Lost motion characterizes low-torque angular behavior and can include elastic deformation. Compare test conventions before comparing supplier numbers; neither alone establishes loaded TCP accuracy.
Must every RV reducer have three stiffness zones?
No. A three-zone fit is a useful modeling option when supported by the curve. Request the supplier's fitted intervals or use measured local slopes. Do not impose the example's 15% and 50% boundaries or its stiffness ratios on another model.
How does temperature affect lost motion over a production shift?
Expansion, preload and lubricant changes can affect the loop and running torque. The direction and magnitude depend on the reducer and installation. There is no supported universal 0.1–0.2 arcmin drift allowance here; request cold- and hot-state measurements under an agreed duty cycle.
Can load-side encoders compensate for reducer lost motion?
They can help reduce steady-state positioning error within controller capability, but sensor accuracy, friction and tuning limit the result. Feedback does not remove physical compliance or guarantee dynamic tracking. Validate the installed axis rather than assuming compensation eliminates the mechanical error budget.
How does 1 arcmin translate into welding or cutting seam offset?
At an effective perpendicular lever arm of 1,200 mm, 1 arcmin corresponds to approximately 0.349 mm. That is a geometric conversion, not a prediction of a seam defect. Actual offset depends on joint configuration, process forces, load history and the other error contributions.
How can I verify a factory hysteresis certificate?
Check unit identity, test conditions, calibration, raw torque-angle samples and repeatability. Ask for a witnessed rerun when records are inconsistent. Plot smoothness and encoder resolution alone cannot authenticate a certificate or establish a pass.
8. Next Steps: Prepare a Reviewable Reducer RFQ
Start with your allowable TCP error, effective lever arm and total torque profile. Request comparable curves, calculate the reducer's contribution and reserve budget for bearings, links, mounts and thermal effects.
- Use our engineering sizing guide for joint load and acceleration inputs.
- Review lifetime testing and inspection metrology when specifying endurance checks; agree a service-life target for your actual duty.
- For cantilevered fixtures, consult the welding positioner RV reducer sizing guide.
To discuss suitable models and the availability of serialized hysteresis test samples, send your torque profile, axis geometry and acceptance limits to the RV Reducer engineering team.
Sources / References
Source review date: November 3, 2026. These references distinguish terminology and test scope; they do not establish the example's assumed parameters, product approval or clause-level compliance. The calculations are reproducible analytical work, not physical test evidence.
- ISO — ISO 9283:1998: Manipulating industrial robots — Performance criteria and related test methods. Robot-level performance standard; not a reducer-specific ±3% lost-motion acceptance method.
- Nabtesco — Technical FAQ. Manufacturer explanations of gear rigidity, hysteresis loss and lost motion. Model-specific guarantees and test details require the applicable catalog and supplier confirmation.
- Scientific study — Global Sensitivity Analysis of Chosen Harmonic Drive Parameters Affecting Its Lost Motion (2021). Primary research on harmonic drives, cited for parameter-sensitivity context. Its results are not RV-reducer performance limits.
Author

Categories
More Posts
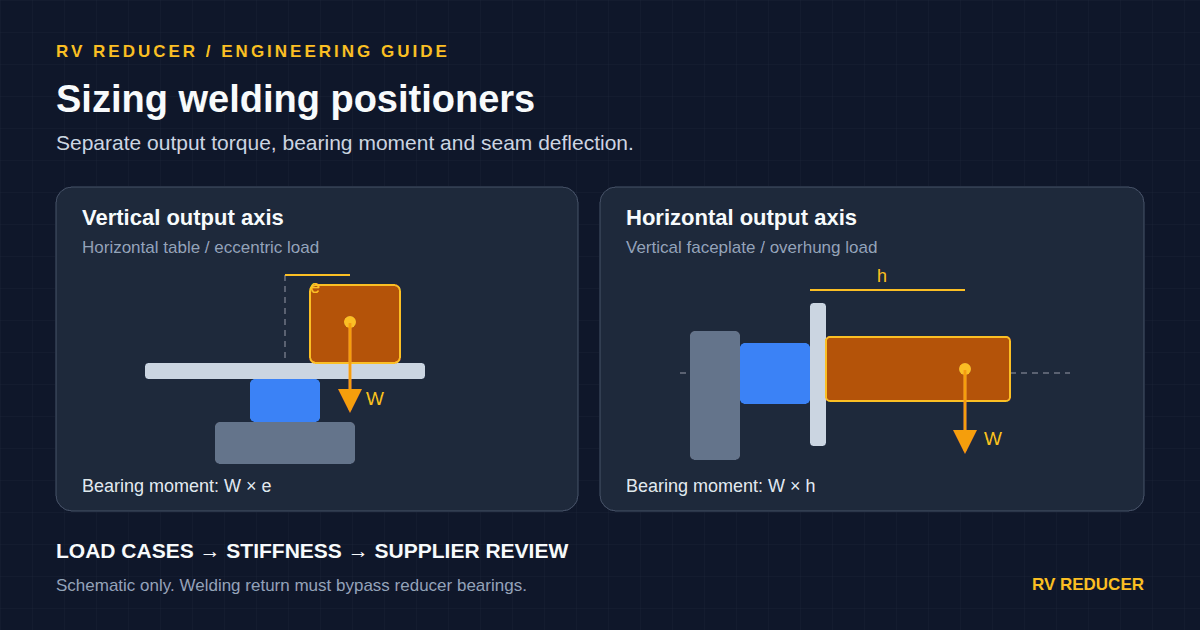
Robotic Welding Positioners and Turntables: Sizing RV Reducers for Overturning Moment, Tilting Stiffness, and Electrical Arcing Protection
Size RV reducers for welding positioners: compare torque, overturning moment, tilting stiffness and welding return paths. Prepare a complete engineering RFQ.
Cycloidal vs. Planetary Wheel Drives for Heavy AMRs and AGVs: Sourcing and Sizing Guide for 1–5 Ton Payloads
Compare cycloidal vs. planetary wheel drives for 1–5 ton AMRs and AGVs. Check wheel loads, sizing and supplier evidence, then prepare an engineering RFQ.
Predictive Maintenance for RV Reducers: A Buyer's and Engineer's Guide to Condition Monitoring
Discover how vibration analysis and thermal imaging can detect RV reducer degradation hours before failure, reducing TCO and unplanned downtime.